How to Monitor Your Avail Validator Node
Learn about monitoring a validator
Telemetry
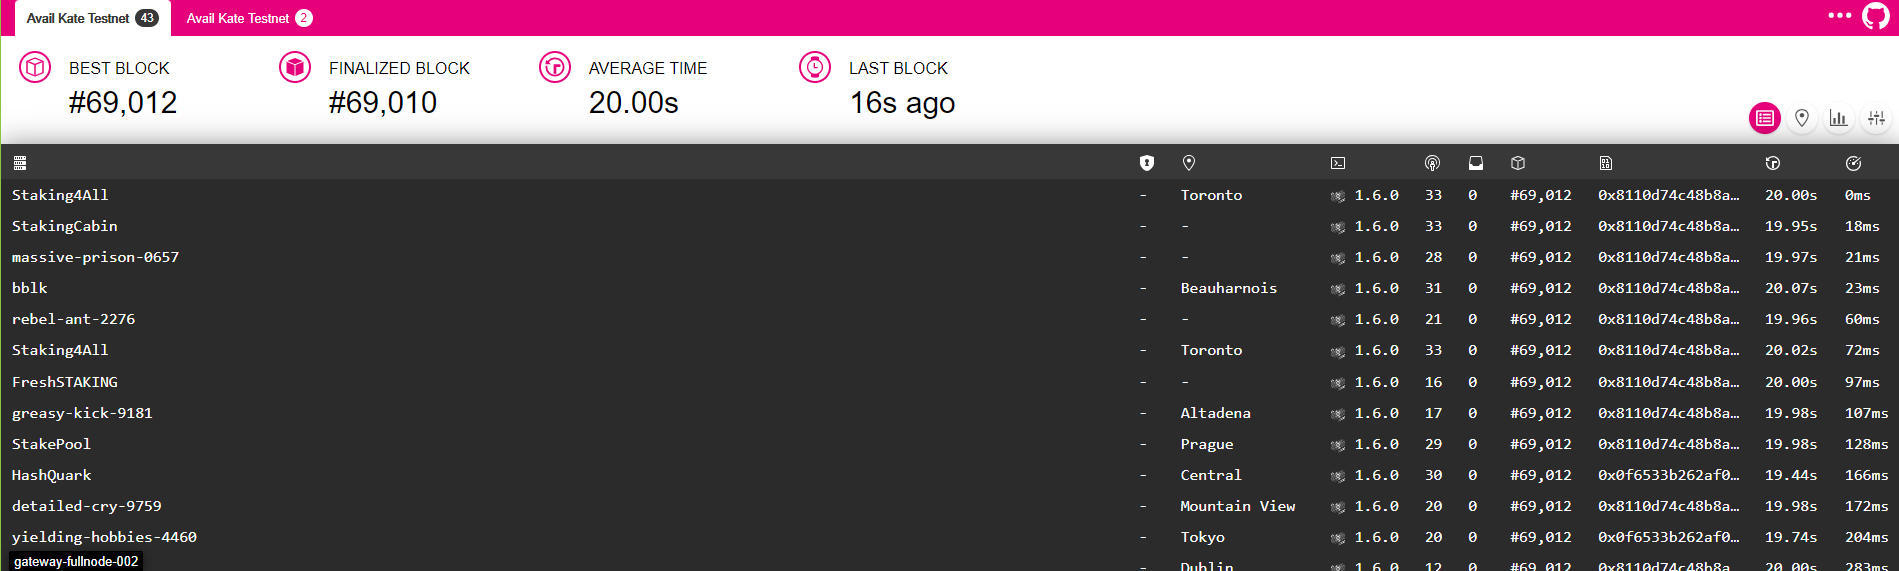 Avail telemetry has been added to the chain specification file and should automatically send telemetry data to Avail public telemetry. You can however also
add the telemetry
Avail telemetry has been added to the chain specification file and should automatically send telemetry data to Avail public telemetry. You can however also
add the telemetry --telemetry-url 'ws://telemetry.avail.so:8001/submit/ 0' to your avail node start command if your node is not visible on the public telemetry.
You can also use --name <Validator Node Name> to set the name that will display on telemetry. Without this it will display a random node name on the telemetry.
For example:
./data-avail --validator \
    --port 30333 \
    --base-path `pwd`/data \
    --chain `pwd`/chainspec.raw.json \
    --name AvailNode \
    --telemetry-url 'ws://telemetry.avail.tools:8001/submit/ 0'
Monitoring with Prometheus & Grafana
--prometheus-external flag in your Avail node's startup command.
Install Prometheus
sudo apt-get install -y prometheus prometheus-node-exporter
cat > $HOME/prometheus.yml << EOF
global:
  scrape_interval: 15s
  evaluation_interval: 15s

rule_files:
  # - "first.rules"
  # - "second.rules"

scrape_configs:
  - job_name: "prometheus"
    scrape_interval: 5s
    static_configs:
      - targets: ["localhost:9090"]
  - job_name: "avail_node"
    scrape_interval: 5s
    static_configs:
      - targets: ["localhost:9615"]
  - job_name: node
    static_configs:
      - targets: ['localhost:9100']
EOF
prometheus.yml to the correct location
sudo mv $HOME/prometheus.yml /etc/prometheus/prometheus.yml
sudo chmod 644 /etc/prometheus/prometheus.yml
sudo systemctl enable prometheus.service prometheus-node-exporter.service
sudo systemctl restart prometheus.service prometheus-node-exporter.service
sudo systemctl status prometheus.service prometheus-node-exporter.service
Install Grafana
wget -q -O - https://packages.grafana.com/gpg.key | sudo apt-key add -
echo "deb https://packages.grafana.com/oss/deb stable main" > grafana.list
sudo mv grafana.list /etc/apt/sources.list.d/grafana.list
sudo apt-get update && sudo apt-get install -y grafana
sudo systemctl enable grafana-server.service
sudo systemctl start grafana-server.service
sudo systemctl status grafana-server.service
Setup Grafana Dashboard
sudo ufw allow 3000/tcp
http://<your validators ip address>:3000. The default login username and password is admin/admin
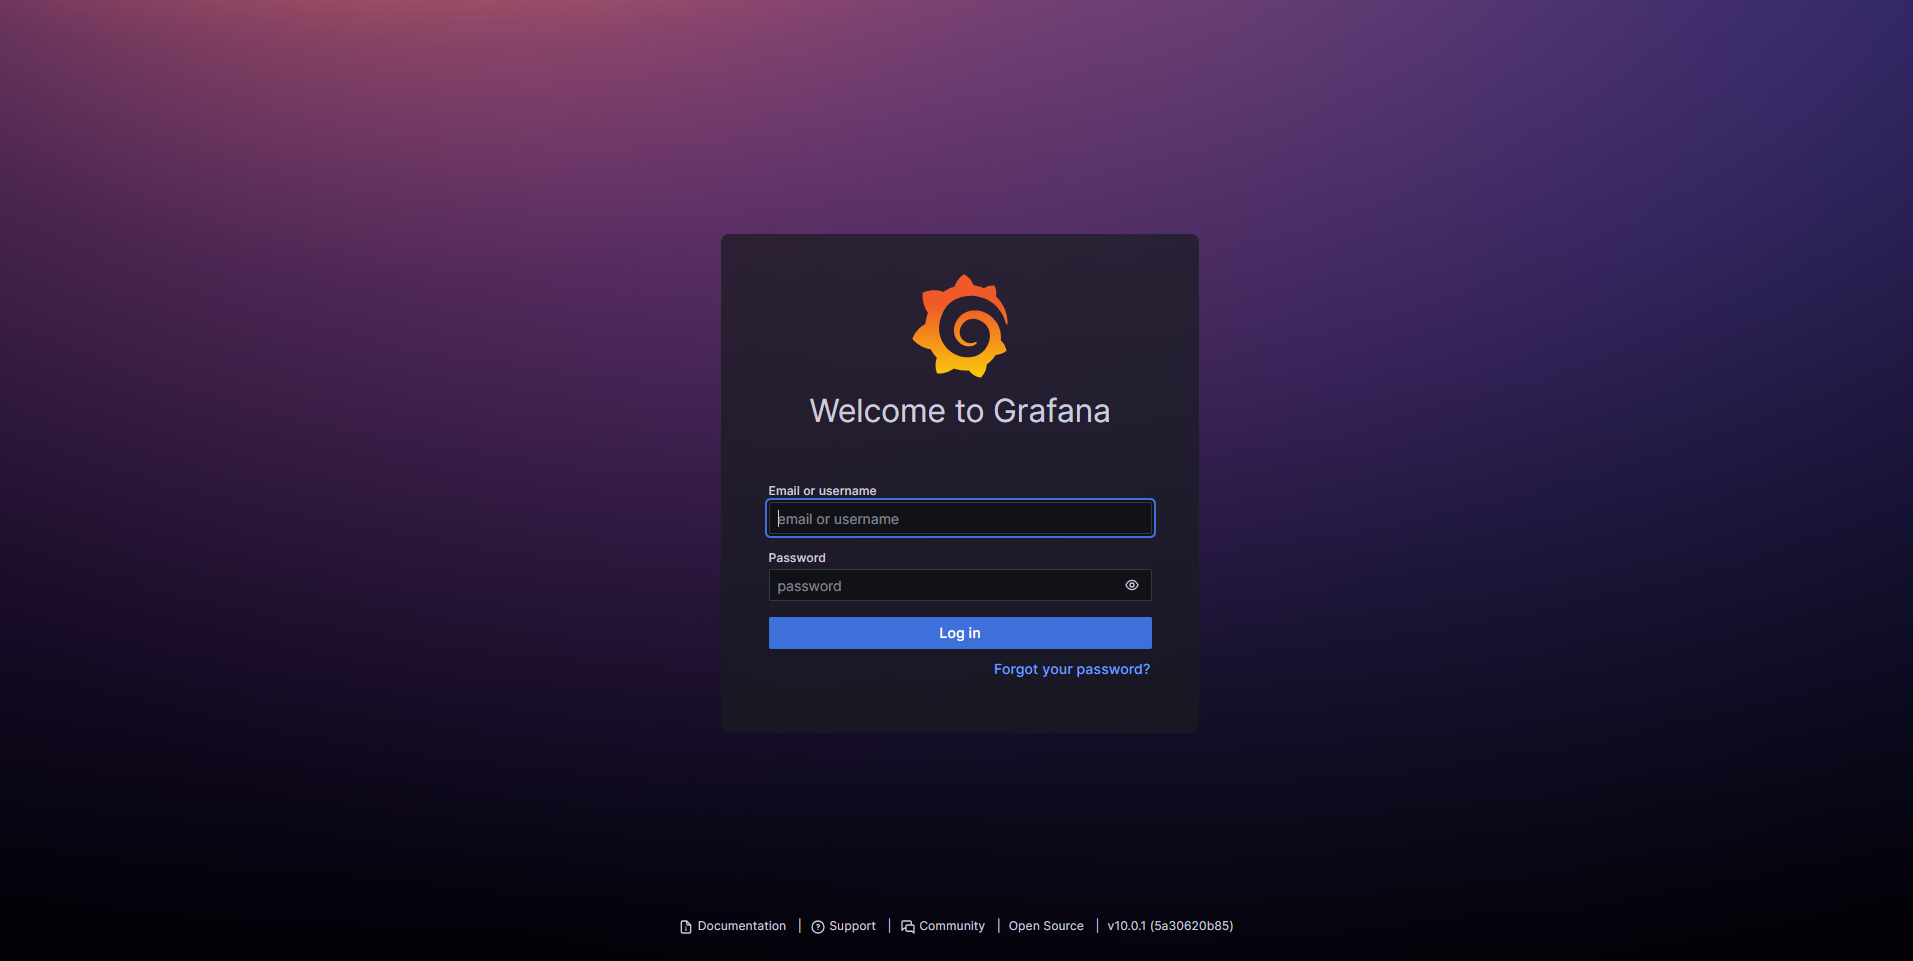 You will be asked to reset your password, please write it down or remember the password as you will need it for the next login.
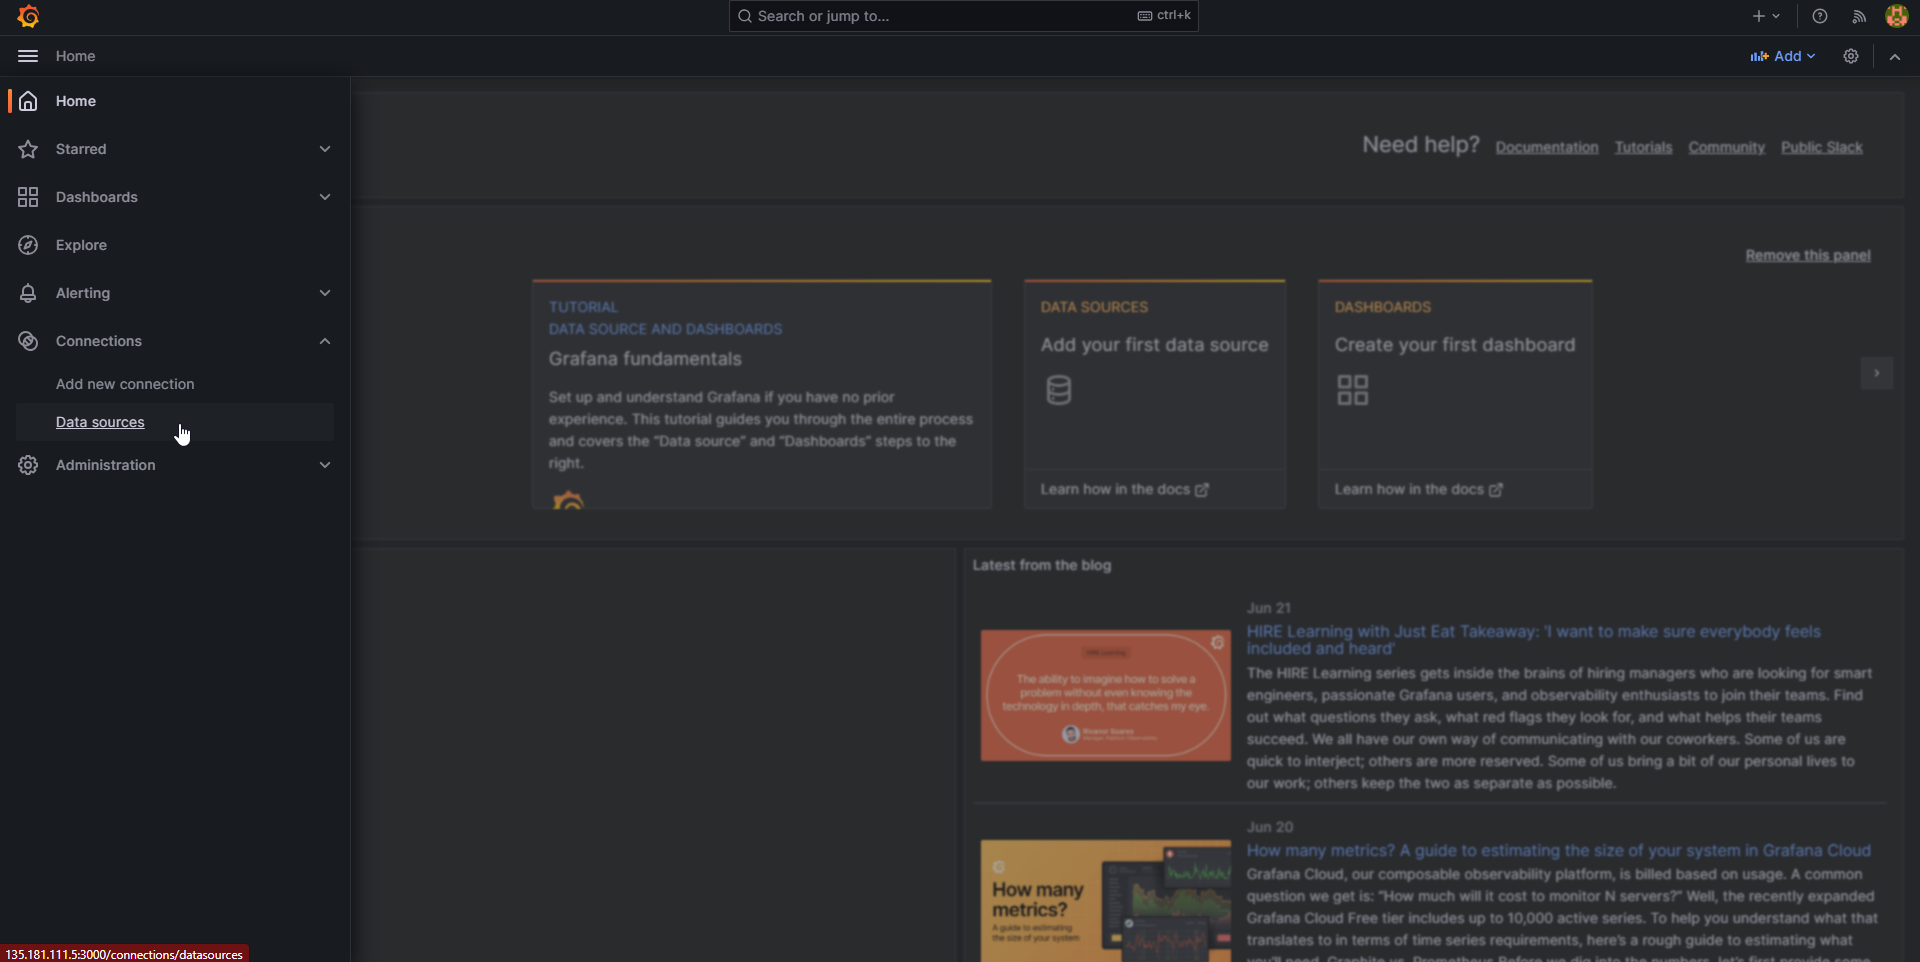
You will need to create a datasource. Navigate to Home->Connections->Data sources
You will be asked to reset your password, please write it down or remember the password as you will need it for the next login.
You will need to create a datasource. Navigate to Home->Connections->Data sources
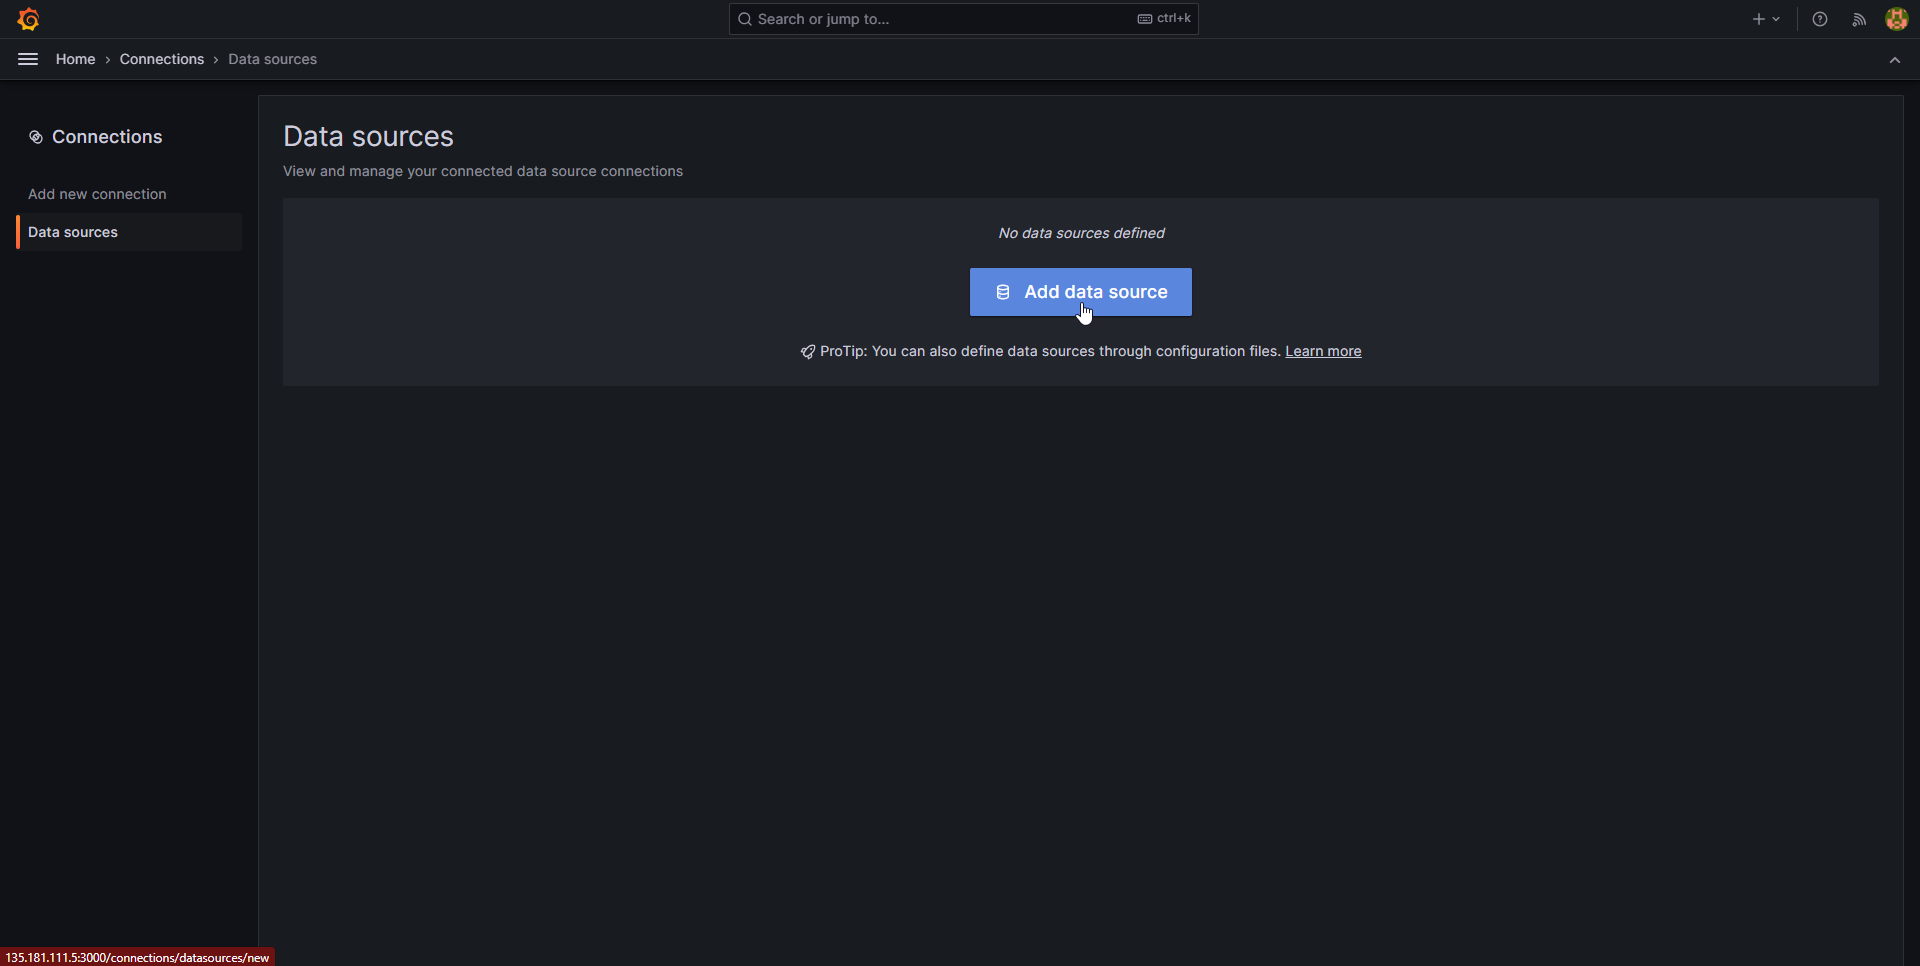
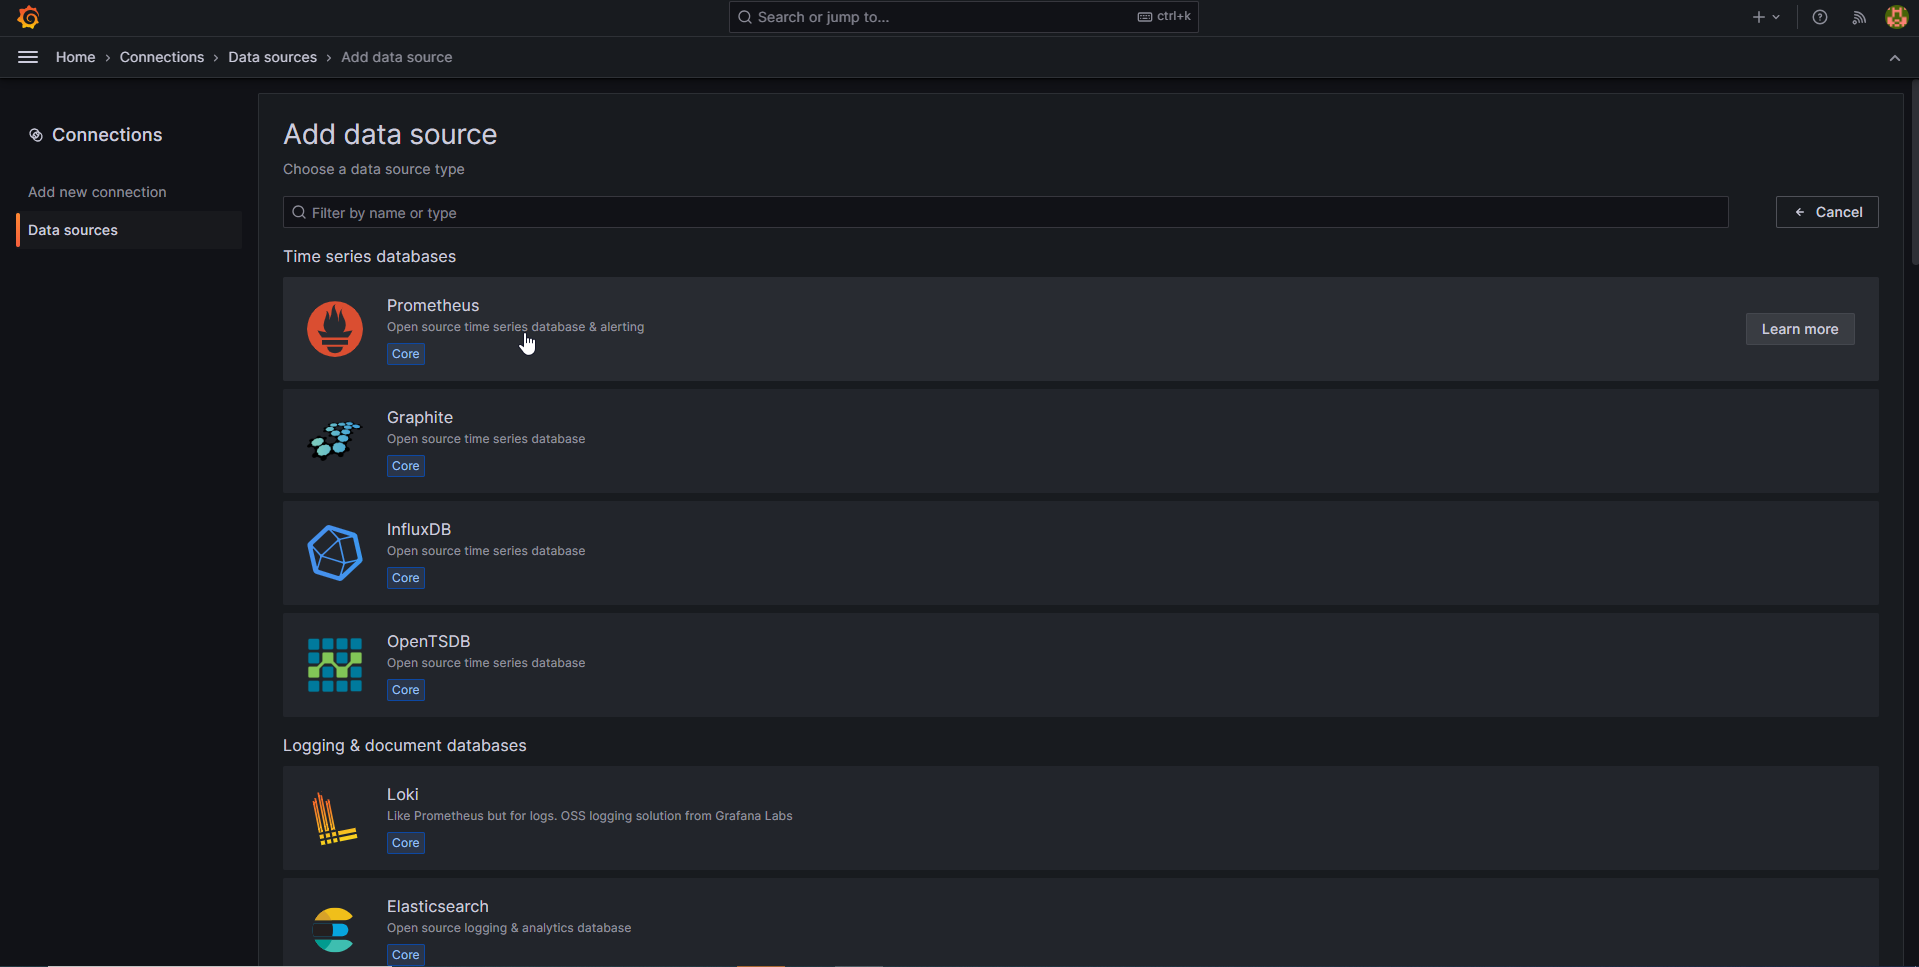
 Click on Add data source
 Click on Prometheus
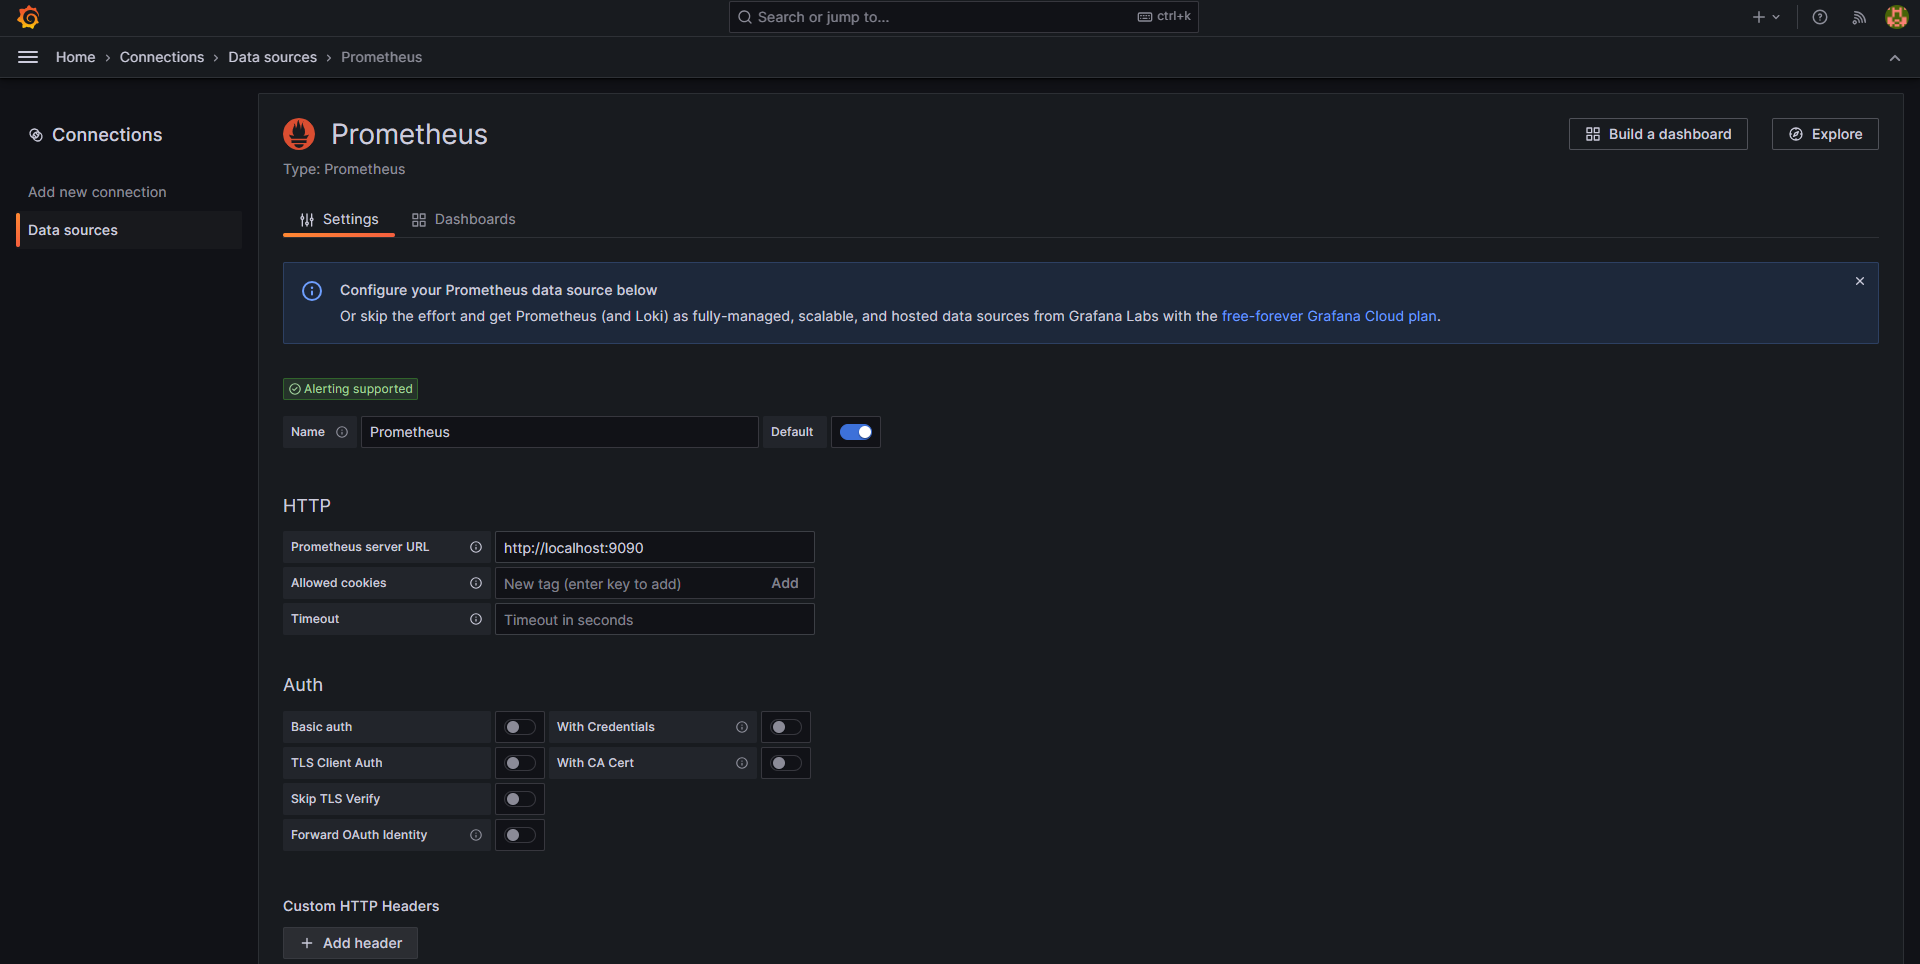
 Set URL to "localhost:9090", then test and save the connection
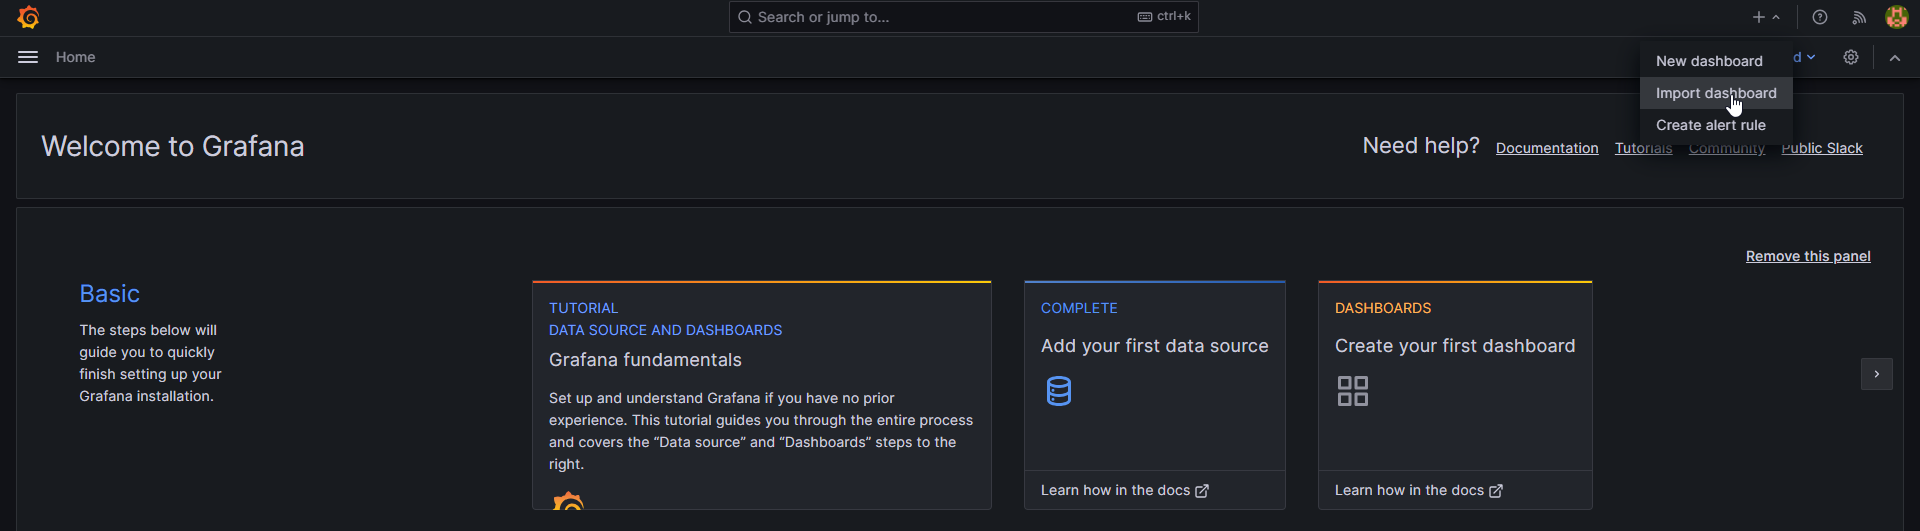
 Navigate back to your home page, on the top right in the menu select Import dashboard
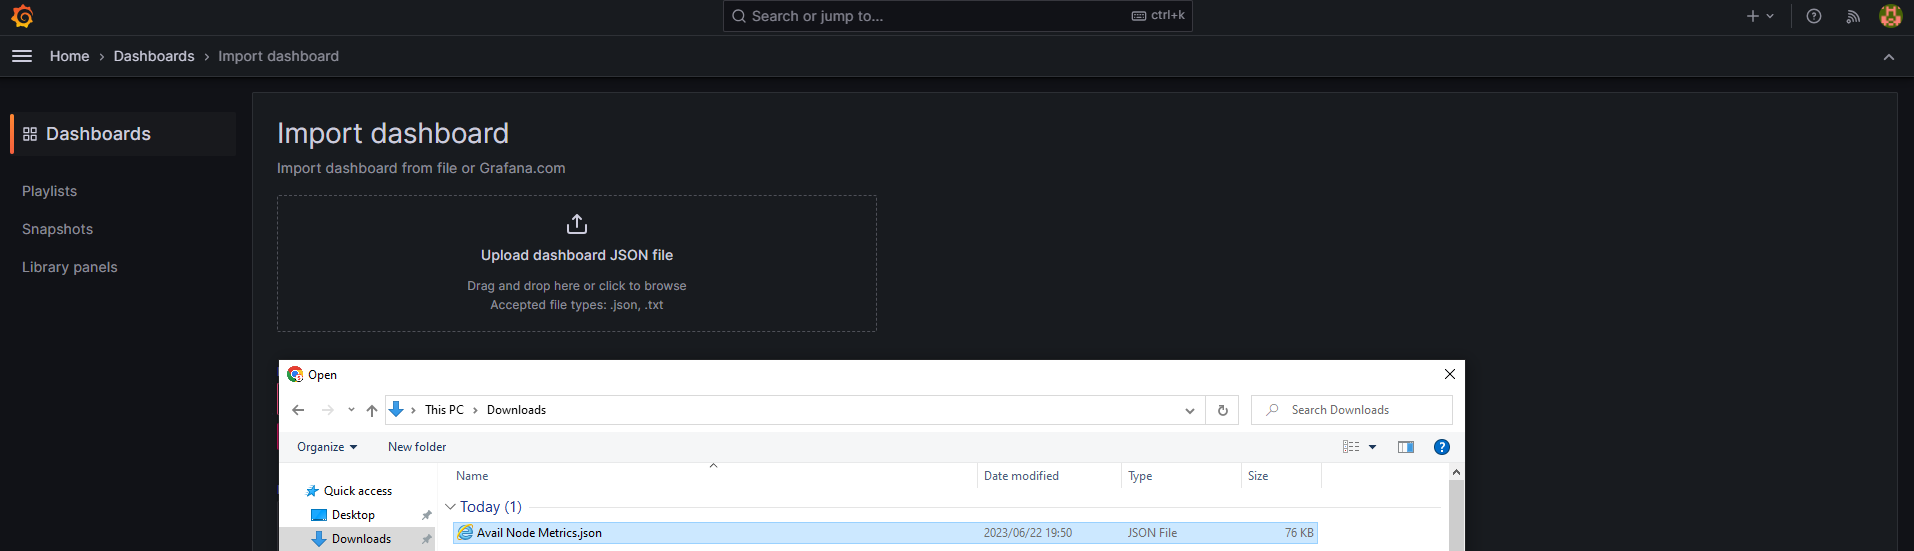
 Import the Avail Node Metrics file
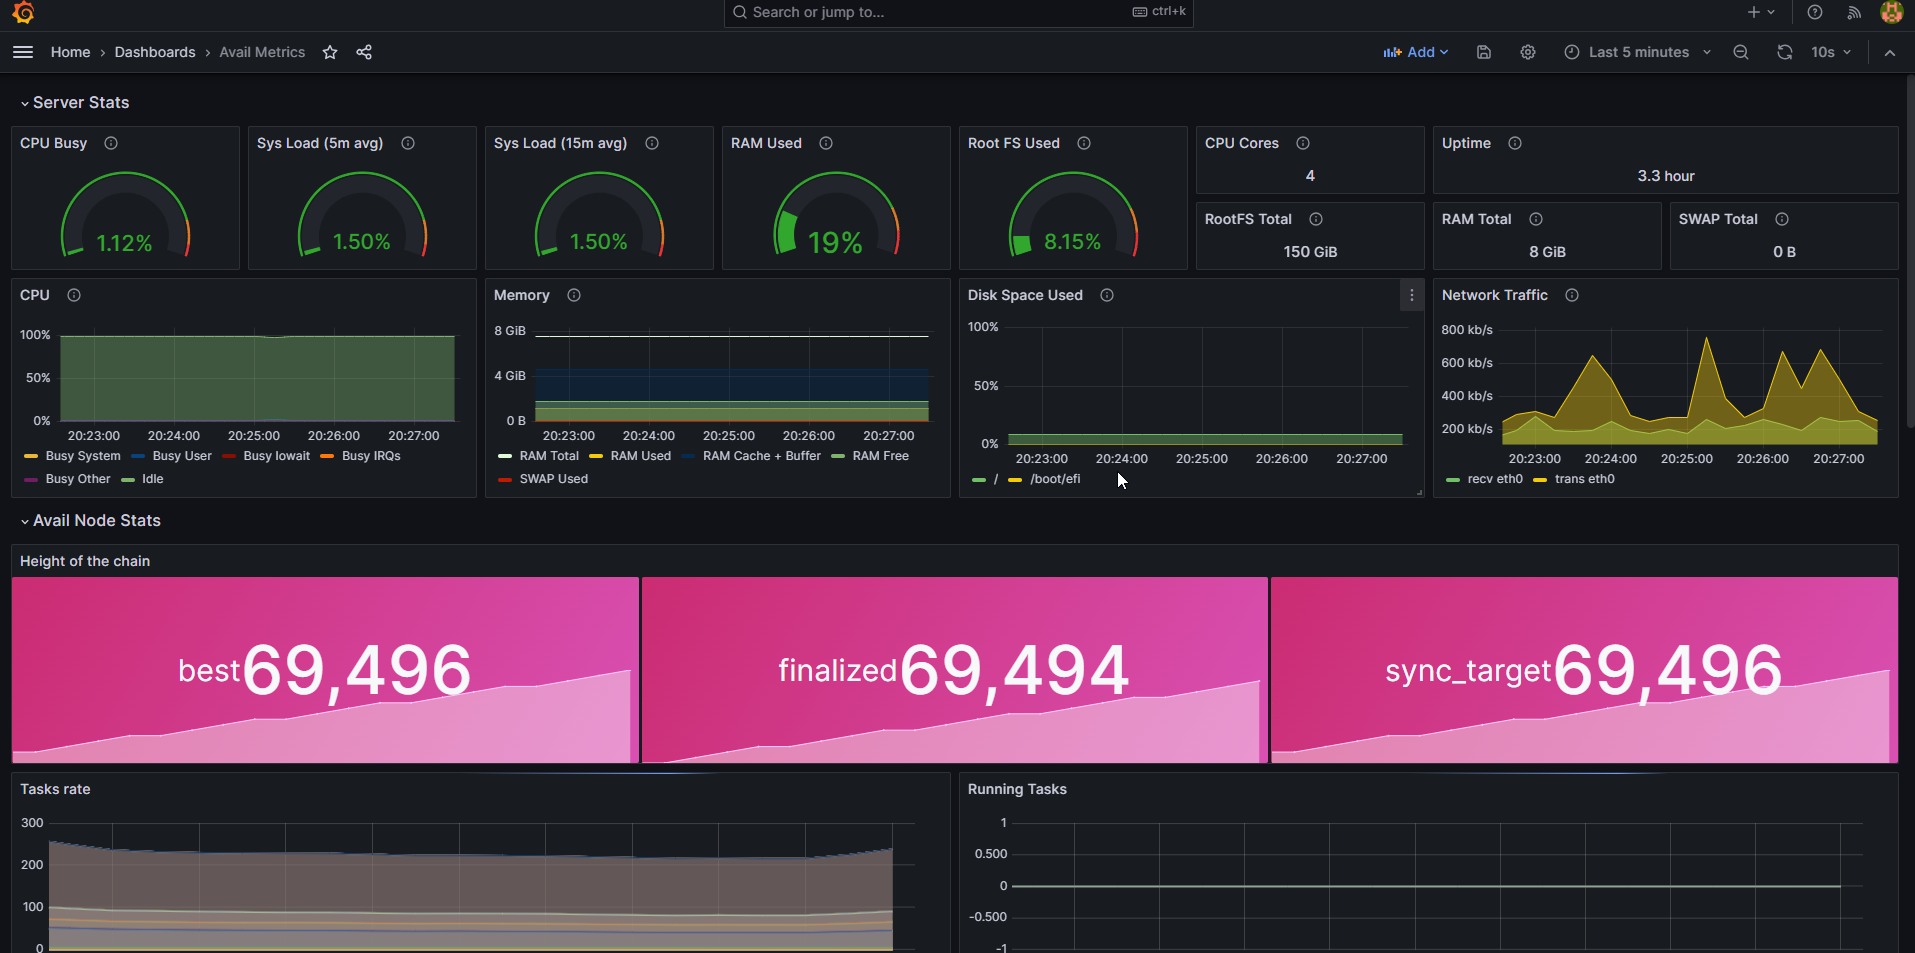
 You will have a new dashboard that opens and that you can use to monitor your node
How is this guide?